A Quick Look at New Relic APM
Note that this is an old article, which is still useful as an historical overview, but should not be considered representative of New Relic’s current capabilities.
I’ve been taking a quick look at an Application Performance Management application called New Relic and thought I’d share my initial findings.
For those who don’t know, an Application Performance Management application (or APM) is a way of monitoring your application in a production (or other) environment, by interacting with the application (for example via the servlet container) and providing information about overall performance and also allowing the support team to drill down into the transactions.
There are a number of APMs available, for example Dynatrace and AppDynamics, but New Relic has its own USP – that it is only available as an SaaS offering (with various charging tiers, including a free option).
This makes it attractive if you want to get a feel for what APMs can offer you, if you want a tactical solution or if you are a startup without the ability to commit to long term licensing deals.
I’ve spent a few hours setting it up on a dummy application and thought I’d share my early thoughts.
My Test Application
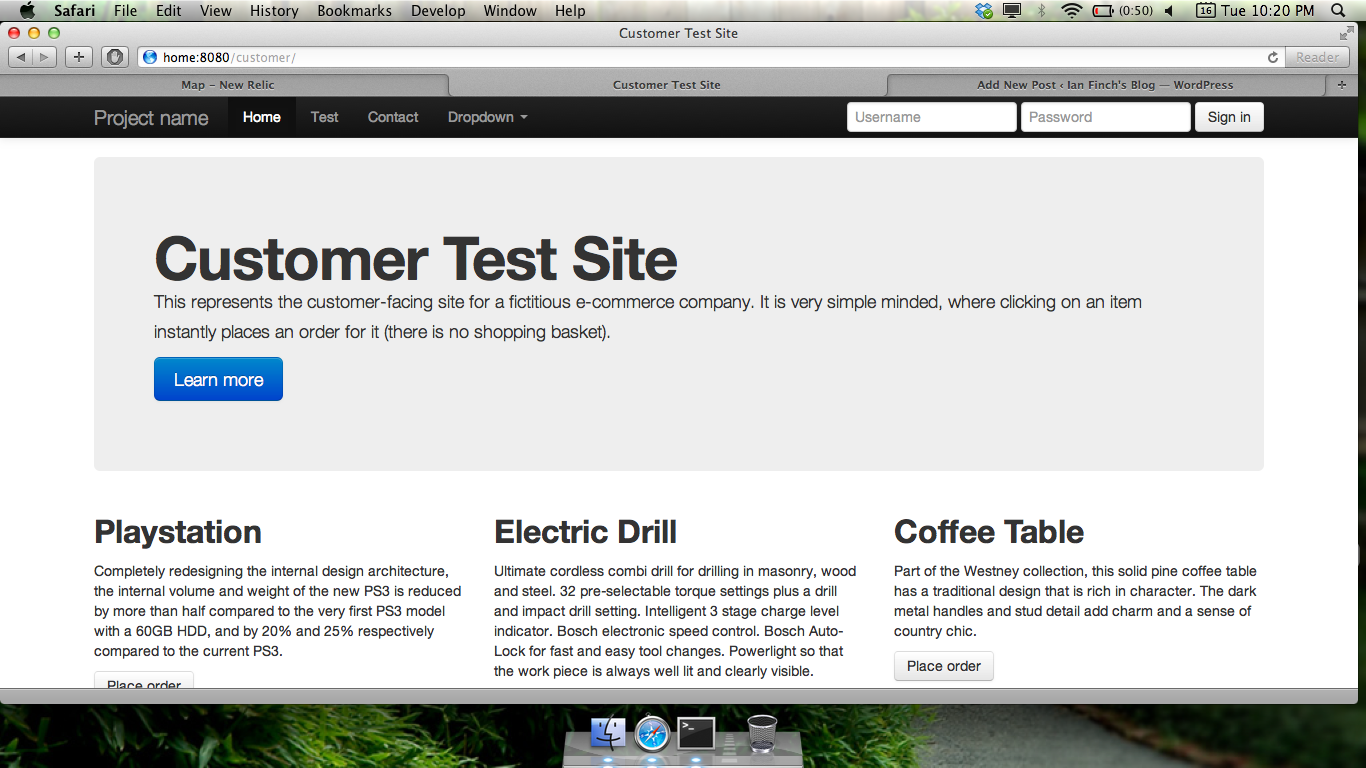
As a quick application to allow me try this out, I set up a simple shop type of system. It consists of three components – a front end (called “customer”), an inventory web service (called “store”) and an authentication web service (called “ID Management”). For simplicity, it uses Redis as storage rather than a database.
These are all running in separate Tomcat instances – all hosted on a computer at home. So, performance isn’t great, but it allows me to try out some of the distributed features of New Relic.
No prizes for my design efforts, but here’s what the front end looks like:
Installation
Installation of New Relic was fairly simple. I took a free signup with New Relic (which includes two weeks free trial of the “Pro” offering). Then I downloaded a jar file which contained the agent. Finally, I followed the “manual installation” steps to get it running. There is a “double click” style of installation, but I wanted to script it (since I would be using three Tomcat servers) so the manual installation was better for me.
The manual installation is easy – just stick the jar file somewhere convenient and then add an option to the JAVA_OPTS to enable it to be invoked (for Tomcat, that’s easiest in the catalina.sh script, but the New Relic site also gives instructions for many other servlet containers, such as JBoss and Websphere).
Then, I just clicked on the website, waited for the agent from the jar file to zap some data back to the New Relic site and then got my display on my account updated.
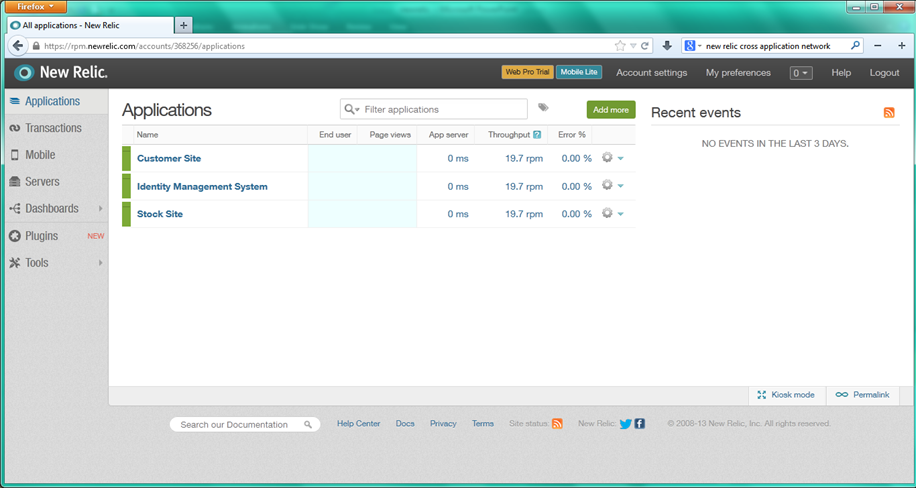
Application Status
The first screen you see in New Relic is the application status. This displays all your applications that New Relic knows about and a RAG status. For my example, this is for the three apps – the user front end, ID management and stock control.
The Application Map
Now we can look at the “application map”. This is New Relic’s “auto-discovery” feature, which shows you the user interaction, the application and calls out to other services.
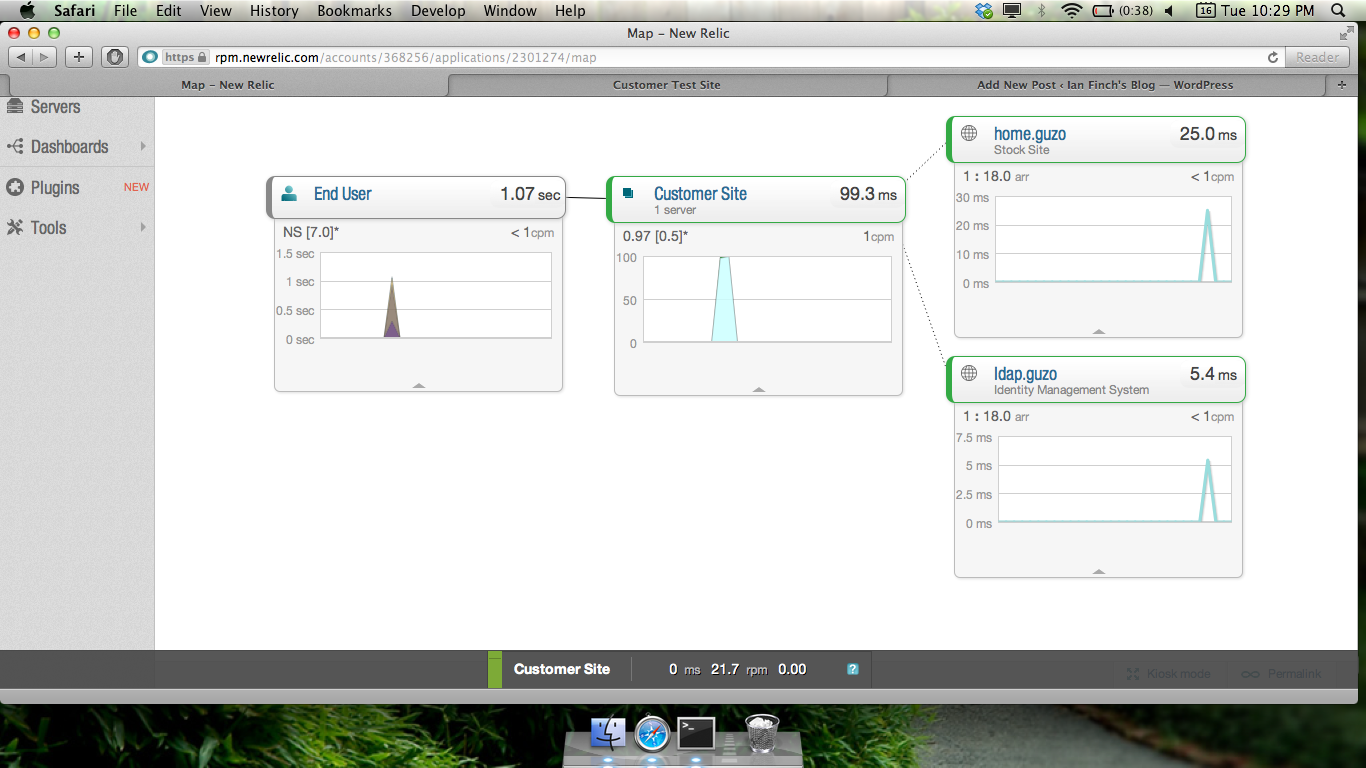
This gives a feeling for the user experience, how it relates to the main application and the effect that the subsequent service calls have on it. It also conveniently shows the structure of my test application.
The user experience (browser side) uses a similar approach to analytics applications – inserting a small amount of Javascript in each page, which sends data back to the New Relic server.
From the New Relic documentation, this Javascript should be automatically inserted by the jar I downloaded (if I set this option in the config). It didn’t work this way for me and I had to add a bit of code to interact with the jar file – however, I didn’t write my app in Java (since I’m not a Java programmer) and I assume it is smoother with Java.
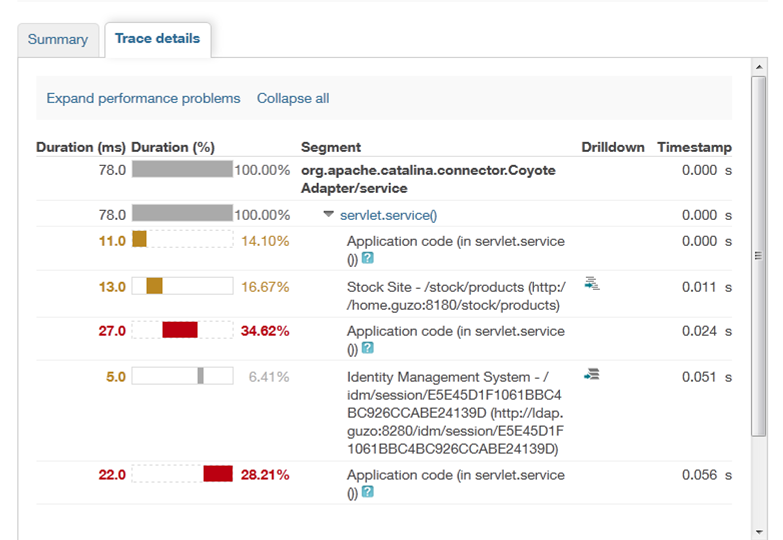
Message Trace
The message trace is where we can start to dig down into the performance of the application. The below trace illustrates how the three applications interact with each other to serve up the page to the user. For example, the below trace shows how much time is spent in each application and the order in which they are invoked. It shows that most time is spent in the frontend application – in the case of this test application, that is because the other parts don’t do much more than respond.
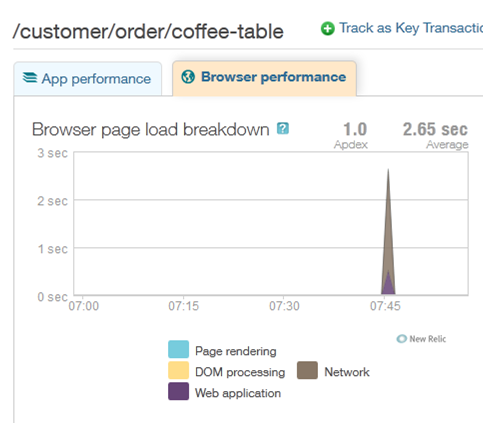
Browser Performance
As stated earlier, New Relic allows access to some information about what is going on in the browser. From the below graph, you can see that most of the time is actually spent in network communications (probably due to my poor wifi between my home server and my laptop). 3 or 4 times as much time is spent on network comms than is spent in the actual web application itself.
This is obviously useful in diagnosing issues when a user reports poor performance. It is also useful for development decisions –– in this case, no amount of optimisation of the application will make a significant improvement in performance, since the major time is spent in infrastructure.
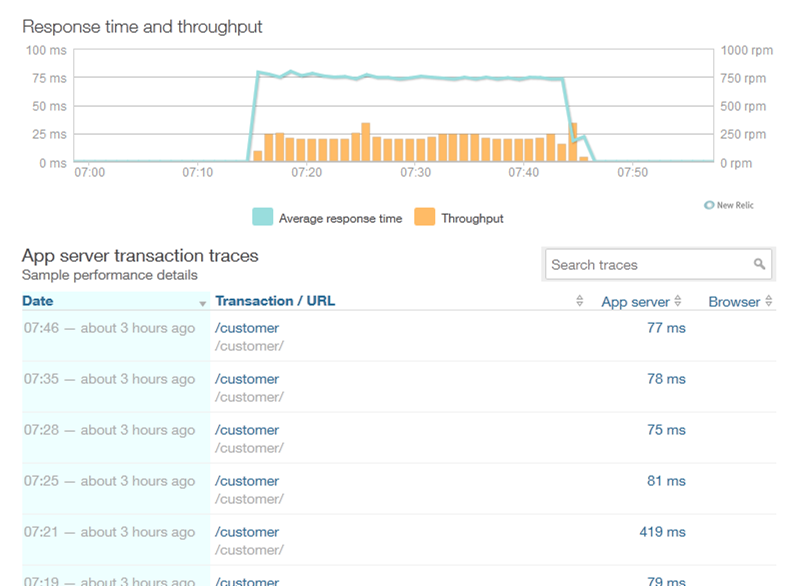
Response Time
The following page shows the response time display. It shows both the response time and number of transactions per minute on a single graph. The graph below shows that response time is around 75ms and we are handling just under 250 requests per minute.
It also shows any slower responses. From there you can click on the slow response and drill down into what is going on (via the message trace screen I mentioned earlier).
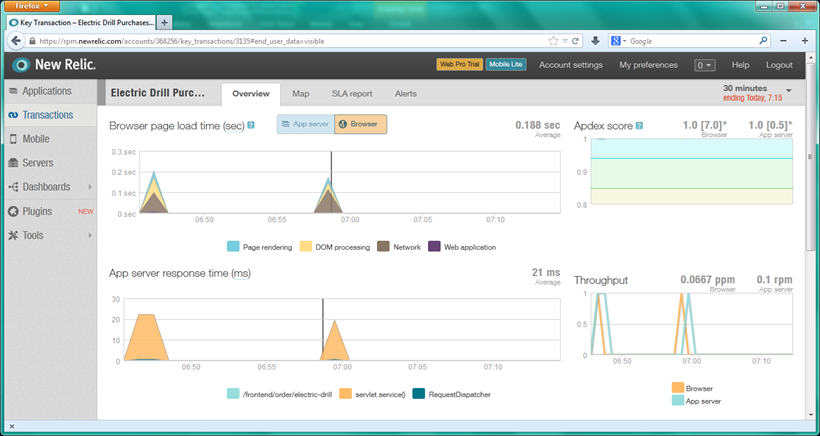
End to End Performance
The following screen shows how both browser and application performance can be displayed together, allowing the server side performance to be directly related to the browser performance.
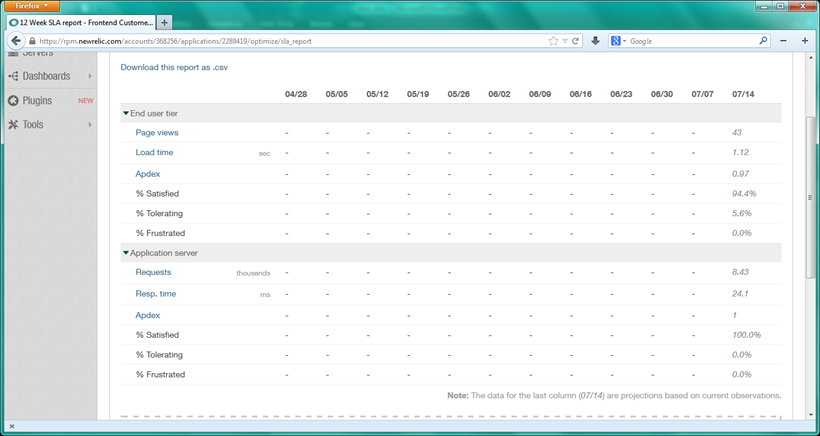
Reports
You can also get some reports from New Relic, to help with things like SLA reporting and capacity planning.
This is the SLA reporting screen …
Areas Not Looked At
There are some features I did not look at.
The monitoring and application map can follow the application into common databases. This didn’t seem to work automatically for Redis and I haven’t taken any time to implement SQL storage (e.g. MySQL) to test out this feature.
New Relic also has a component which can monitor the server performance. This then allows tracking to be followed through from the application to the underlying servers. Since this is all running on a fairly old home computer, I didn’t want to put even more load on it to try this out.
New Relic allows tracking of time spent within the infrastructure before a connection hits the Tomcat server. This is achieved by getting the front device (e.g. firewall or router) to insert a header with a timestamp which is then picked up when the message hits the Tomcat server. Again, I didn’t want to stand up an additional service (such as HA Proxy) to do this.
New Relic has many plug-ins to extend its capabilities. I did not spend any time looking at these.